
See your business weekly — not just at month end.
A practical approach to building weekly, board-ready reporting inside NetSuite.
P&L accuracy
NetSuite analytics
Executive reporting
or email liam@clearsuitereporting.com
A practical approach to building weekly, board-ready reporting inside NetSuite.
or email liam@clearsuitereporting.com
How do you build weekly budgets in NetSuite?
Can NetSuite report budget by customer group or channel?
How do you compare this week vs last year?
How do you forecast mid-month performance?
Period-based structure doesn’t match weekly operations
Budget detail is hard to get out alongside actuals
Reporting moves into Excel
Numbers don’t reconcile cleanly
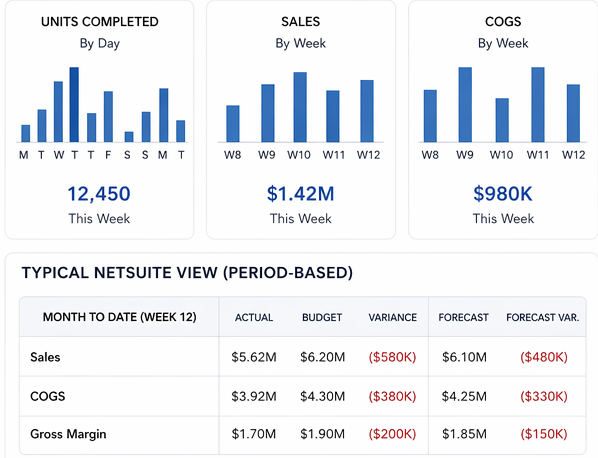
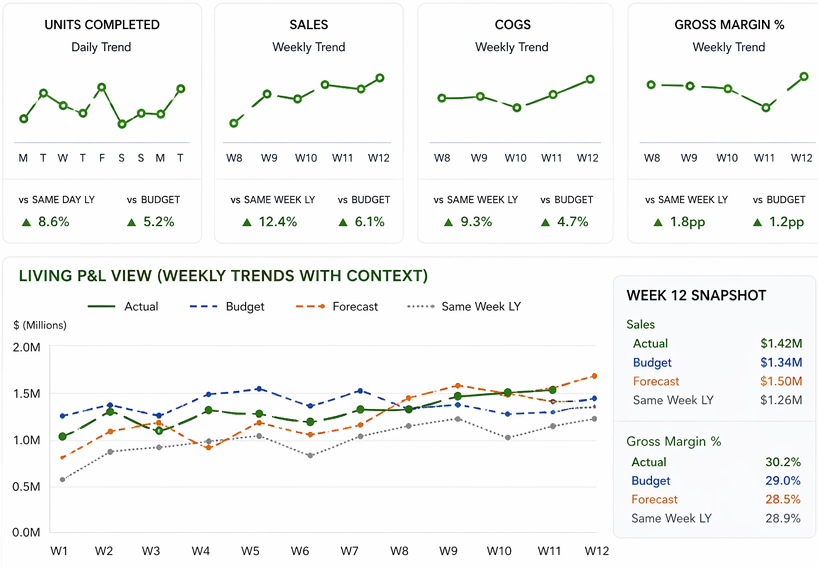
Illustrative mock-ups with sample figures, not screenshots of NetSuite or of client data.
Four complementary layers that bring financial and operational reporting together inside NetSuite.

Conceptual diagram. The layers are complementary, not a fixed implementation sequence; dashboards and figures are illustrative.
Introduce weekly calendar structure aligned to operations
Build budgets and forecasts at segment level (customer, channel, site)
Organise NetSuite financial activity into consistent management reporting structures. ClearSuite's semantic mapping framework translates accounting classifications and available transaction dimensions into defined reporting measures, with reconciliation controls against the underlying ledger.
ClearSuite's SpeedLedger provides a curated, reporting-ready financial data layer inside NetSuite, designed to make historical and comparative financial analysis faster and easier to work with. Reporting outputs can be delivered through NetSuite or made available to external BI platforms where appropriate.
See performance weekly before it’s too late
Make decisions during the month, not after it.
Understand margin at the level you actually operate
Trust the numbers without Excel reconciliation
Client outcome: A multi-site FMCG business moved from monthly reporting in Excel to daily visibility of weekly performance, all reconciled to the P&L in NetSuite.

Client outcome: A finance team reduced reporting prep time from days to hours.

Reporting capability: Executive visibility into margin by customer group and channel. The chart is illustrative, with sample data.

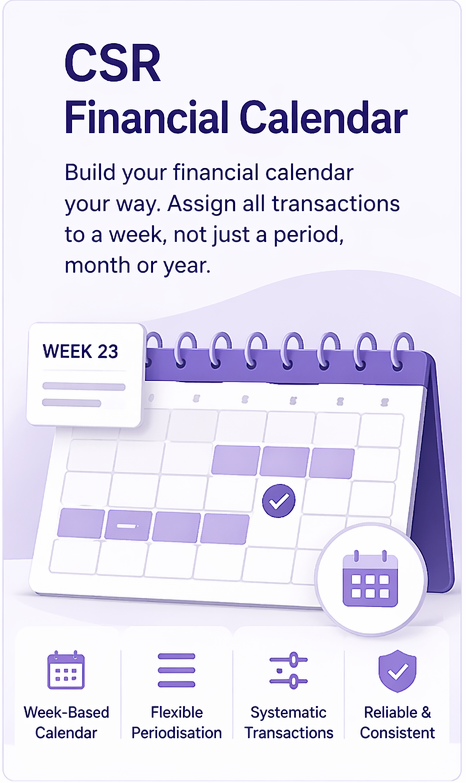
Purpose: Teaches NetSuite what week it is.
How it works: Define the financial calendar around how your business operates, including 4-4-5 structures where required. ClearSuite provides a consistent weekly reference framework that reporting processes can use to attribute financial and operational activity to the appropriate reporting week.
Problem solved: Accounting periods alone don’t give a consistent weekly base for reporting and comparison.
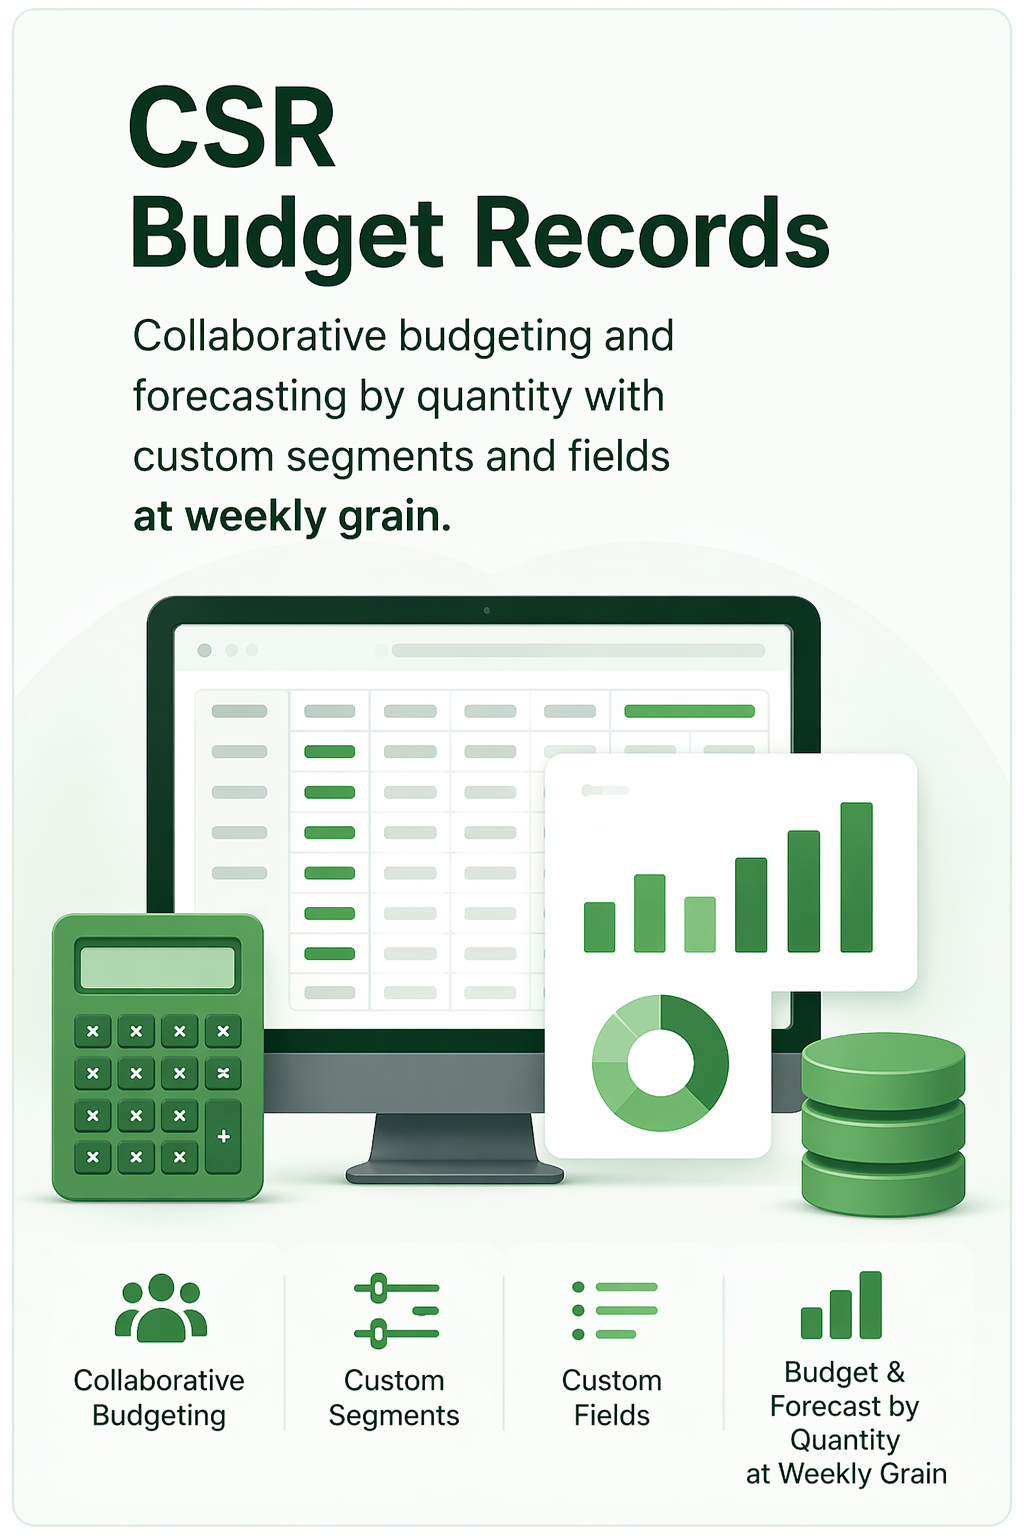
Purpose: A budget layer that treats budgets like transactions.
How it works: Budgets and forecasts at weekly grain, by custom segments and custom fields (quantity planning in development). Built collaboratively and aligned directly with actuals.
Problem solved: Native NetSuite budgets support accounting periods and configured reporting dimensions. But accessing budget detail for flexible analysis, aligning budgets to operational weeks, and planning by quantities or additional business attributes can require workarounds. CSR Budget Records provides an alternative structure designed around those reporting needs.

Purpose: A curated, flattened financial reporting layer: a data mart designed for board-level reporting, inside NetSuite.
How it works: Structured for speed and clarity. It’s in use today as a management ledger at a food manufacturer, where it renders years of data in seconds onto dashboards and into board packs.
Problem solved: At high data volumes (for example in manufacturing or fast ecommerce), searches can get complex and long-range SuiteAnalytics queries can slow down. SuiteAnalytics works best when data is already in the right shape.
If you're struggling with NetSuite reporting, I’ll show you what’s possible — and how quickly we can get there.
Working with ERP systems since 1998, specialising in NetSuite since 2009.
Why would you build something like BI in NetSuite, in a world of BI, data lakes, and emerging AI analytics?
Why I bothered →